Pinpointing air pollution from space
For the first time, air pollution from individual cities and built-up areas can be detected from space. The new service, that pinpoints sources of pollution precisely and analyses global pollutant distributions, is based on measurements from the European Sentinel-5 Precursor Earth observation satellite.
The TROPOsphericMonitoring Instrument (TROPOMI) on board the satellite provides daily global measurements of ozone, nitrogen dioxide, carbon monoxide, and aerosol and cloud properties. With a spatial resolution of 3.5 kilometres by 7 kilometres, the TROPOMI multispectrometer outperforms comparable systems by a factor of 100. This means greater precision than ever before. The data gathered are freely available.
Volcano eruption
As an example, on 26 June 2018, shortly before the end of its test phase, the surveillance satellite detected the eruption of the Sierra Negra volcano on the Galápagos Islands. At around 20:12 local time (02:12 UTC on 27 June), Sentinel-5P detected extremely high concentrations of sulphur dioxide over the volcano, and was able to determine the spread of the gas cloud with great accuracy.
Also, the TROPOMI instrument has measured the level of nitrogen dioxide emission coming from specific power plants in India, the spreading of smoke from forest fires in the US and Sweden and much more, with unprecedented accuracy.
Technically demanding
This service, which operates almost in real time, is technically demanding, but crucial for users, as change processes in the atmosphere often occur very fast. Overall, Sentinel-5P provides a complete global dataset for atmospheric composition every day.
The satellite data are sent to two receiving stations in the Artic, one in Inuvik, Canada, and one in Svalbard, Norway. From there the data are sent through research & education networks to the German Aerospace Center, DLR, and to by the Royal Netherlands Meteorological Institute (KNMI) for processing and analysis.
This is a shortened version of a news item first published by DLR. For more details and the full story please go to: https://www.dlr.de/dlr/en/desktopdefault.aspx/tabid-10081/151_read-28852/#/gallery/31367
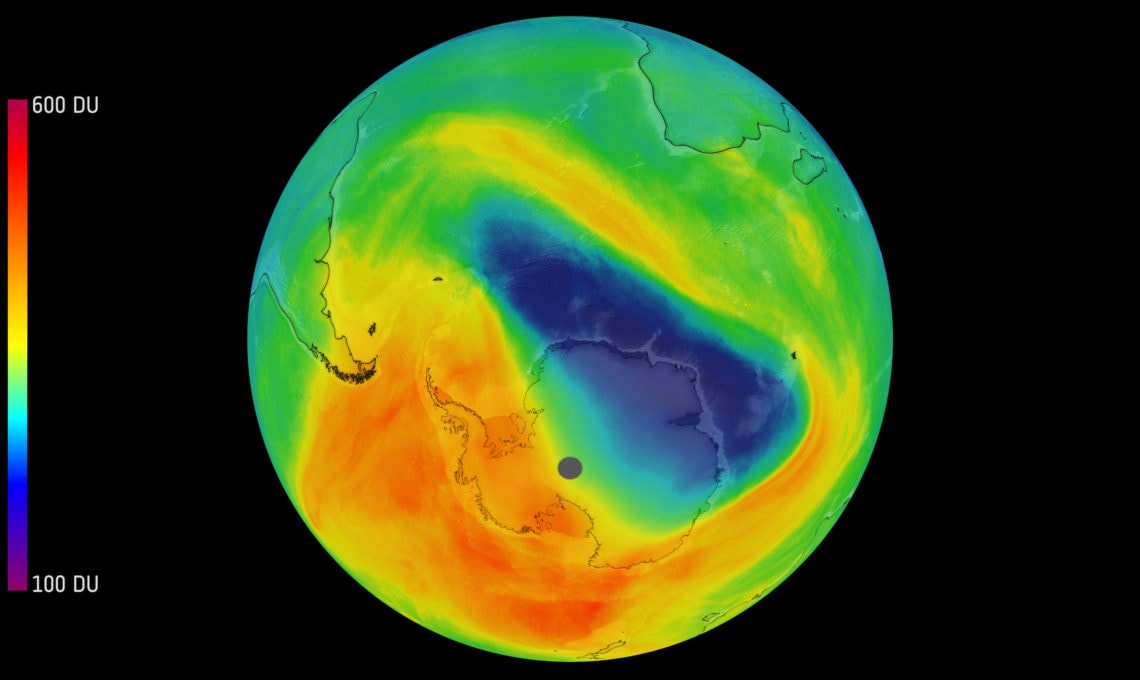
Image above:
Ozone hole over the Antarctic: The Sentinel-5P mission will produce a global atmospheric composition dataset over the course of each day. The DLR Earth Observation Center (EOC) creates different products from he data, which are made available no later than three hours after the measurements were performed. The example here shows the distribution of ozone over the southern hemisphere on 9–10 November 2017. The very thin ozone layer (blue) over the Antarctic is particularly noticeable.
Credit: CopernicusSentinel (2018), DLR/ESA.
For more information please contact our contributor(s):