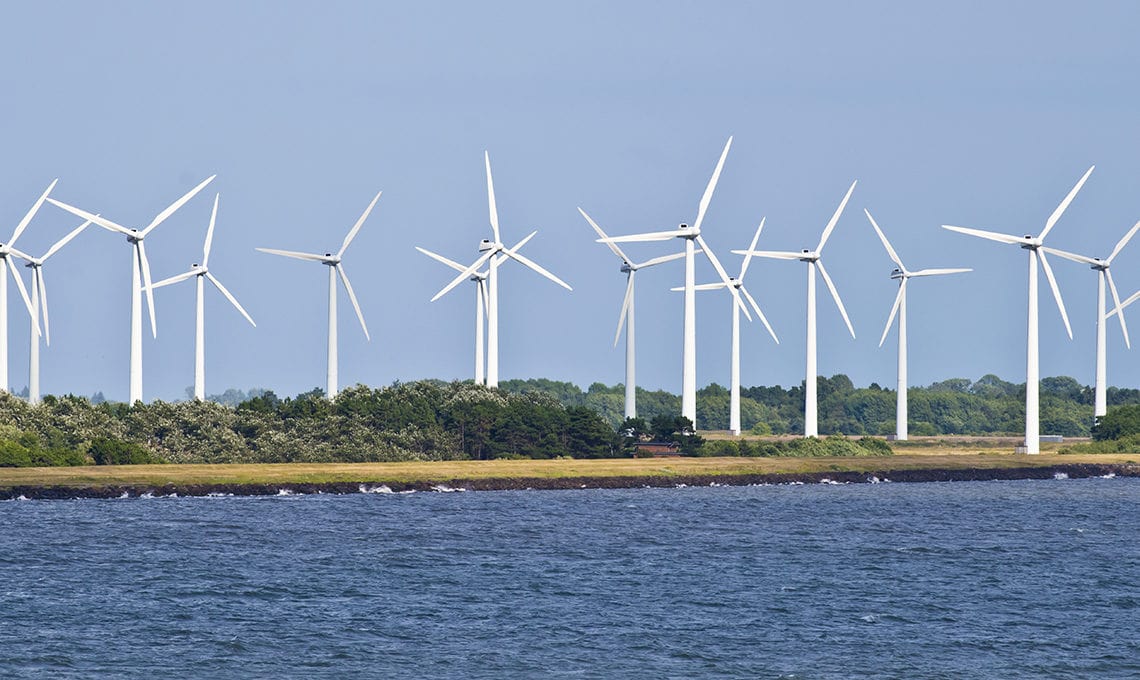
Mapping Europe’s wind energy resource
In a world craving renewable and zero-carbon energy, the economic and societal importance of wind power has become huge. Given the magnitude of investments it is imperative that the wind farms are erected in the locations with the best wind resources. That is the main purpose of the so-called wind atlases invented and refined through several decades by Danish researchers. The atlases can only be created through extensive use of supercomputing.
A total of six petabytes of raw data was produced during simulations behind the creation of NEWA, the New European Wind Atlas. NEWA is a database of wind conditions for the entire European continent, able to pinpoint suitable locations for the installation of wind farms. The simulations were done in the international High-Performance Computing cluster PRACE.
“In addition, we needed a single computer to avoid introducing differences between local calculations. At the end of the day, the NEWA could not have been performed without supercomputing,” says Andrea Hahmann, Senior Scientist at DTU Wind Energy, Technical University of Denmark, at the homepage of Danish research e-infrastructure provider DeiC.
Wind maps within 24 hours
“Denmark has been a pioneer within wind energy for almost half a century. For instance, the creation of the first European Wind Atlas and the design of turbines that nobody else in the world was doing more than 30 years ago,” says Xiaoli Guo Larsen, Senior Scientist at DTU Wind Energy.
A major part of the data input for the wind atlases is generated by Earth observation satellites and meteorological satellites. Wind data generated from satellite observations was initially stored on local discs, later switching to storage at local server facilities. These facilities have been upgraded several times over the years as the amount of available satellite date increases constantly.
“In my research, we collect satellite observations of radar signals that are returned from the sea surface, and these observations can be converted to maps of the ocean wind speed. Data is processed in near real-time, meaning data is downloaded from the Copernicus Open Access Hub every day, and wind maps are published online within 24 hours,” says Merete Badger, Senior Scientist at DTU Wind Energy.
These calculations are performed on the High-Performance Computing (HPC) facility SOPHIA based at DTU. The SOPHIA system is a part of the national Throughput HPC operated by DeiC.
Data transfer is becoming a challenge
A large part of the calculations for the NEWA atlas were carried out at the HPC MareNostrum4 in the Barcelona Supercomputing Centre (BSC) via PRACE.
“During the NEWA project, the biggest obstacle was the data transfer, as it took as long to transfer the data from the BSC cluster to our machine in Denmark as it took to generate the data. Sometimes the flow stopped. If we couldn’t transfer data, we couldn’t continue running. The computations took about six months, and the data transfer was nearly the same,” says Andrea Hahmann, adding:
“In the future, there will probably be even higher competition for HPC resources, and it may not be manageable from our individual sites to provide the right support for accessing both national and international supercomputing.”
The text is inspired by the article “World-class wind energy research builds upon supercomputing” published on the DeIC website.
For more information please contact our contributor(s):

